Life expectancy
Infographic
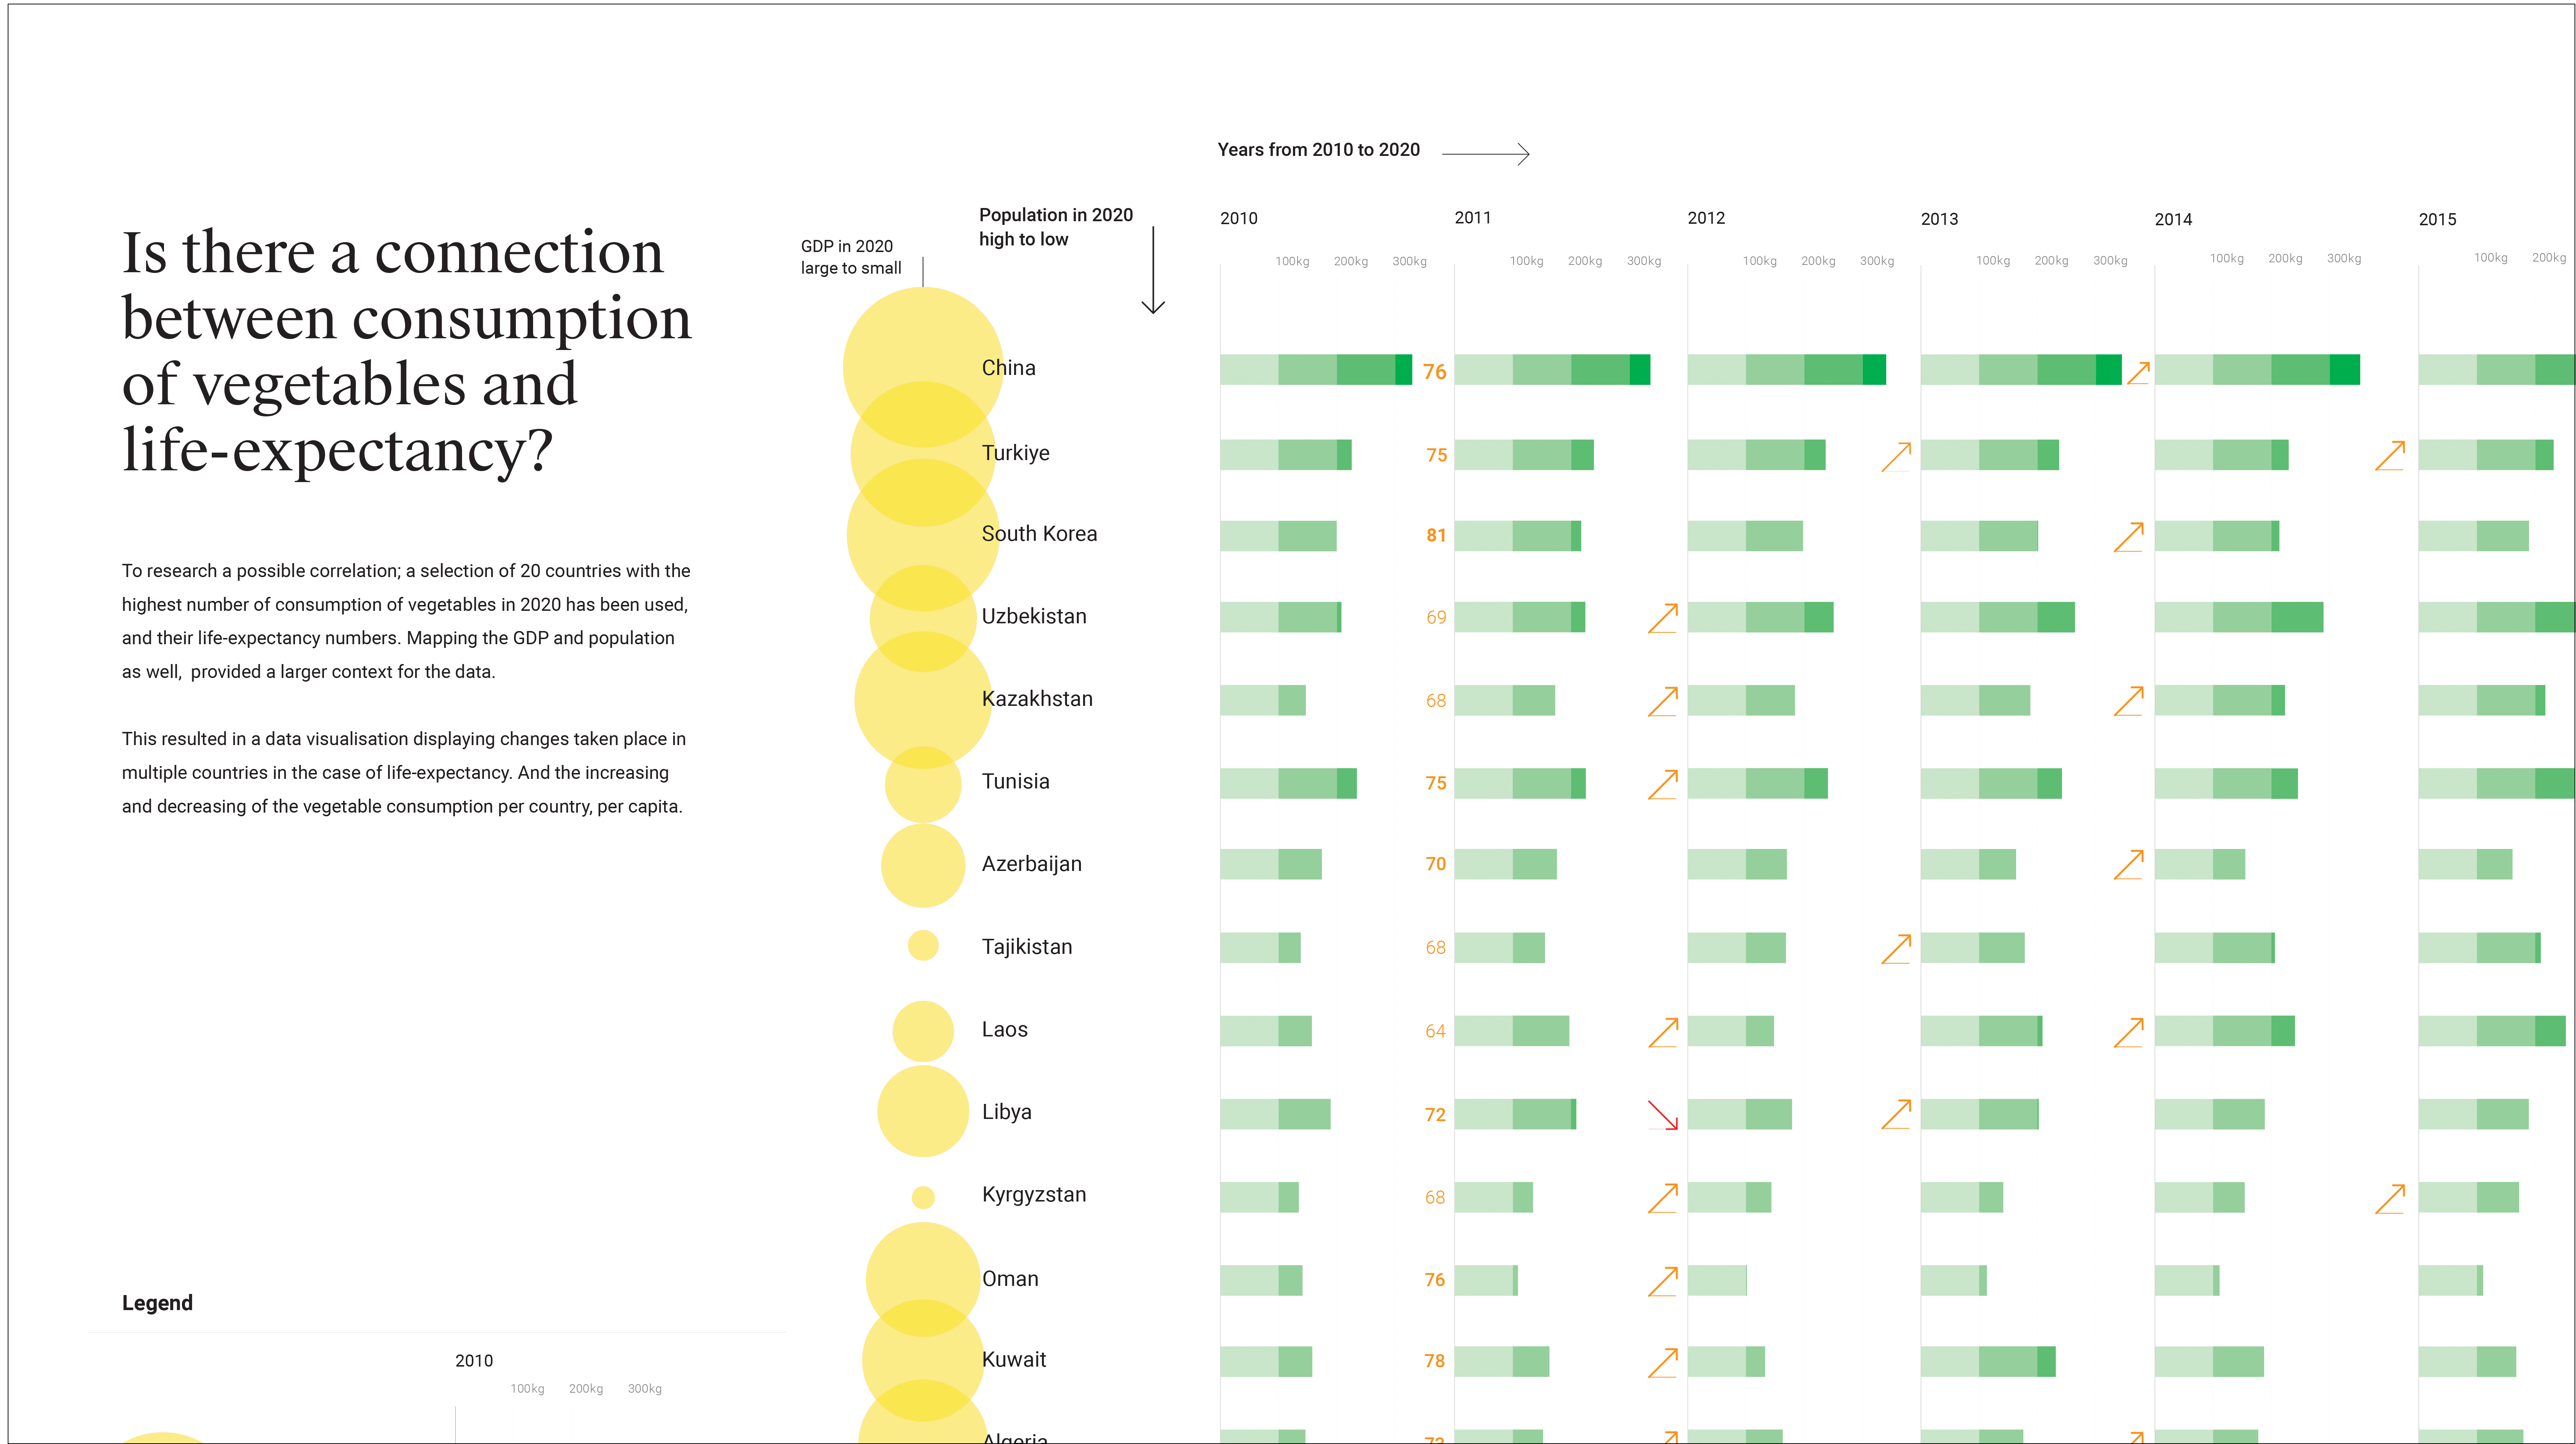
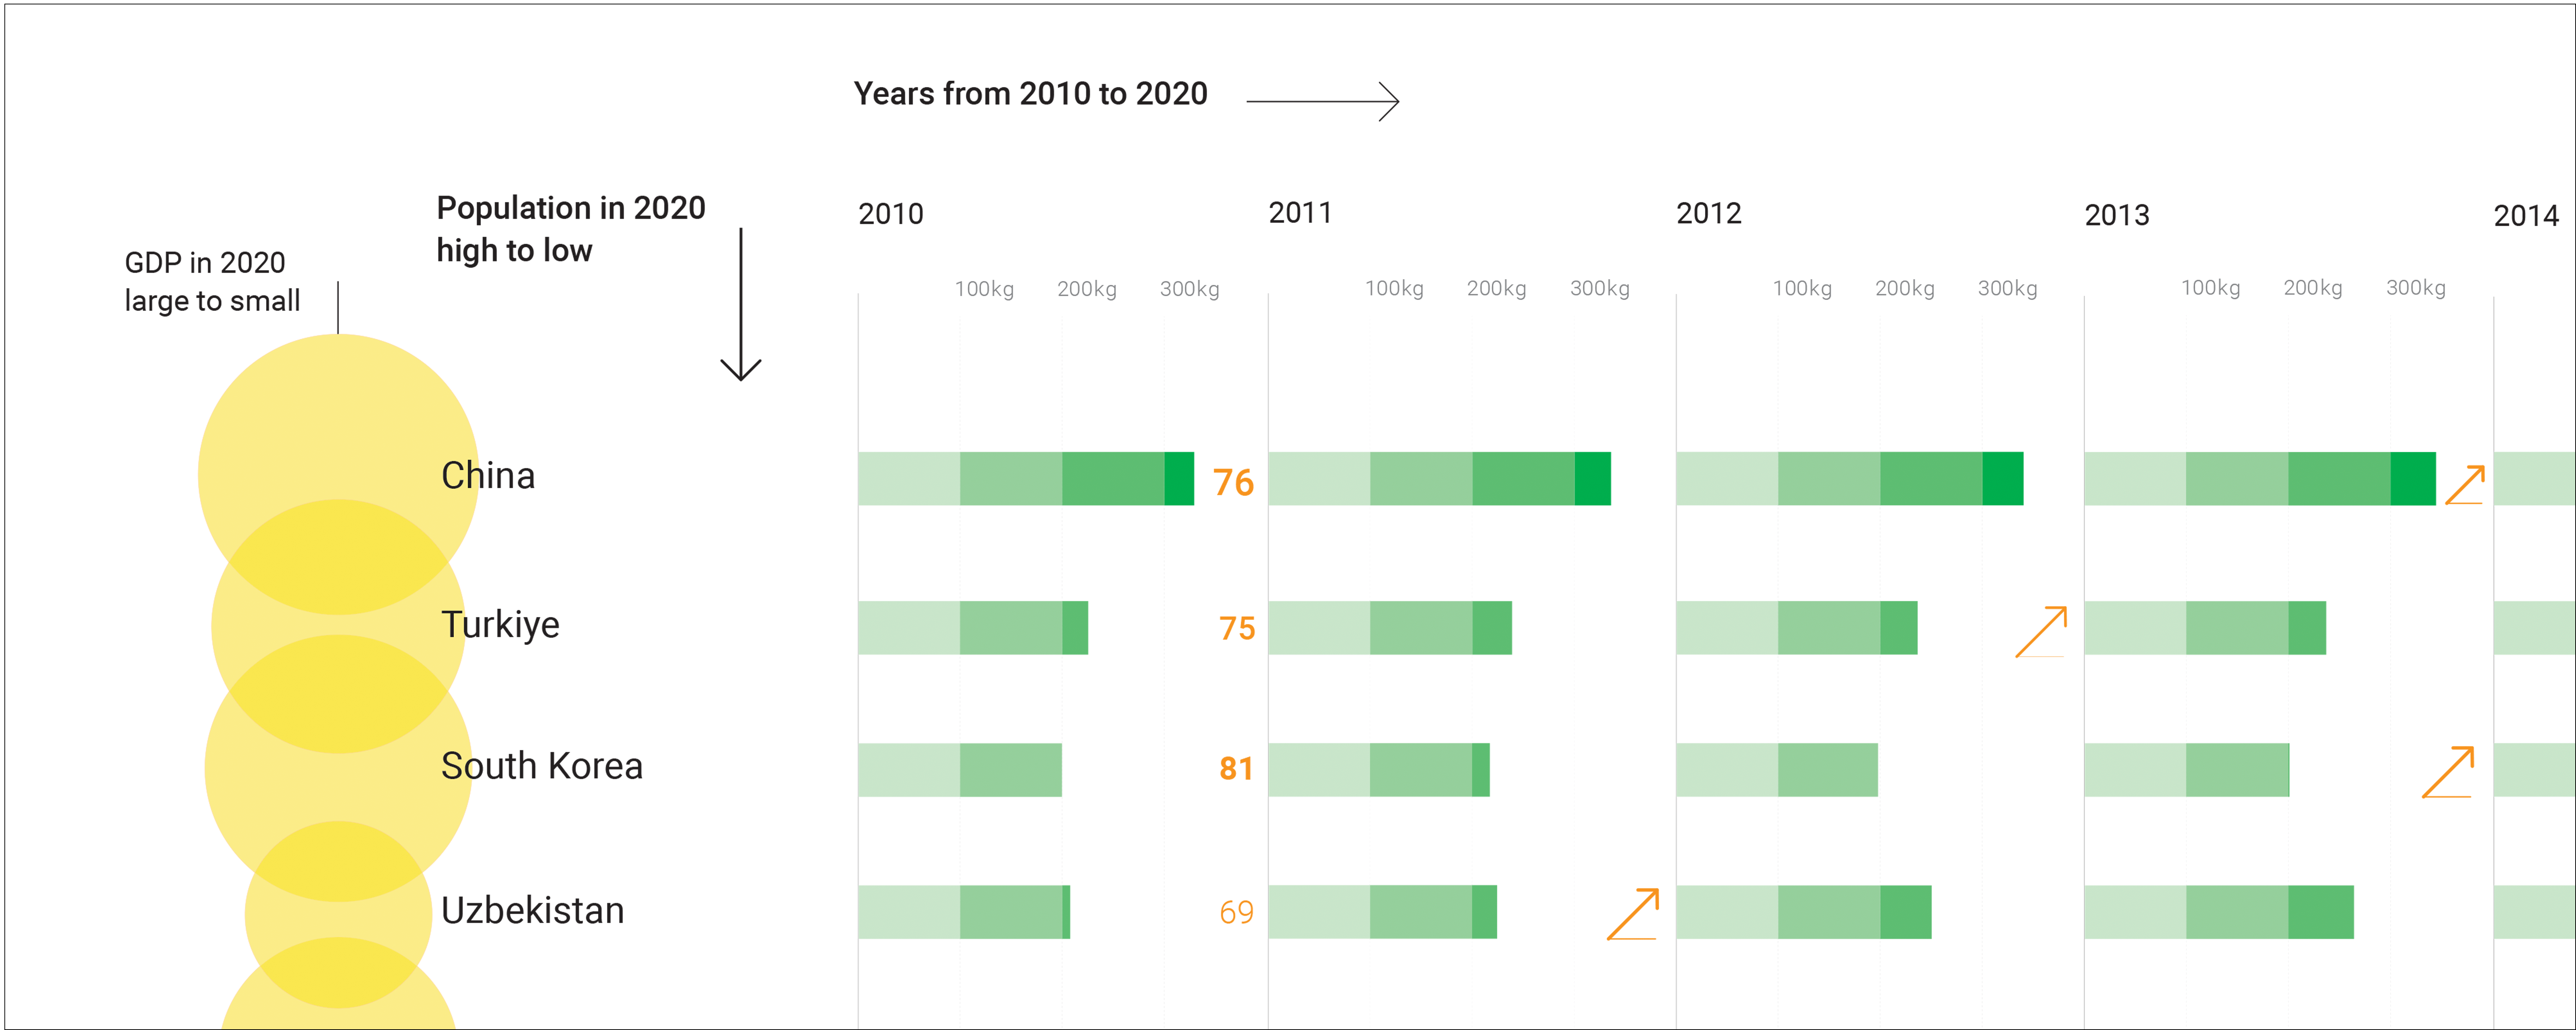
In the data visualization, the focus is on the relationship between vegetable consumption and age expectations. The goal was to visualize connections between the different data sets.
20 Countries and their vegetable consumption are compared with the average age expectation, what each country produces in services and goods in 2020 and the number of inhabitants in 2020 each country had.